MSChart中DataManipulator.FinancialFormula 枚举值
| Member name | Description | |
|---|---|---|
| 累积分配 | AccumulationDistribution |
Accumulation Distribution formula uses a relationship between volume and prices to estimate the strength of price movements; if volume is increased, there is a high probability that prices will go up. |
| 平均正确范围 | AverageTrueRange |
Average True Range indicator measures commitment and compares the range between the High, Low and Close prices. |
| 波林格区间 | BollingerBands |
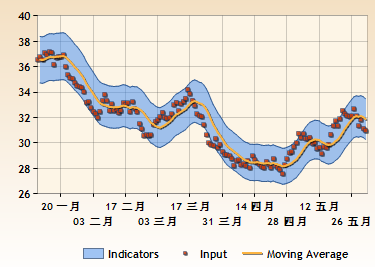
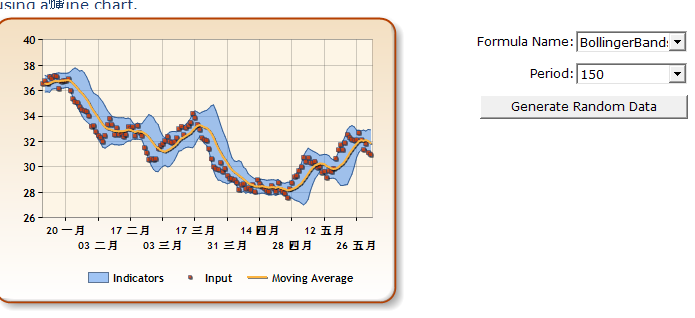
Bollinger Bands indicators are plotted at standard deviation levels above and below a simple moving average.
|
| 查金振荡器 | ChaikinOscillator |
Chaikin Oscillator indicator is the difference between a 3-day exponential moving average and a 10-day exponential moving average applied to the accumulation distribution. |
| 商品频道指数 | CommodityChannelIndex |
Commodity Channel Index compares prices with their moving averages. |
| 去趋势价格振荡器 | DetrendedPriceOscillator |
Detrended Price Oscillator attempts to remove trends from prices. |
| 乐观移动 | EaseOfMovement |
Ease of Movement deals with the relationship between volume and price change, and uses volume to indicate how strong a trend is for prices. 易于移动处理体积和价格变化之间的关系,并使用体积来表示价格的趋势是多强。 |
| 信封 | Envelopes |
Envelopes are plotted above and below a moving average using a specified percentage as the shift. 信封是标注上下移动平均使用指定的百分比作为转变。  |
| 指数移动平均线 | ExponentialMovingAverage |
An Exponential Moving Average is an average of data calculated over a period of time where the most recent days have more weight. |
| 预测 | Forecasting |
Forecasting predicts future values using historical observations. 使用历史观测预报预测未来值。 |
| 质量指数 | MassIndex |
The Mass Index is used to predict trend reversal by comparing the difference and range between High and Low prices. |
| 中间价格 | MedianPrice |
Median prices are mid-point values of daily prices and can be used as a filter for trend indicators. |
| 资金流动 | MoneyFlow |
The Money Flow indicator compares upward changes and downward changes of volume-weighted typical prices. |
| 移动平均 | MovingAverage |
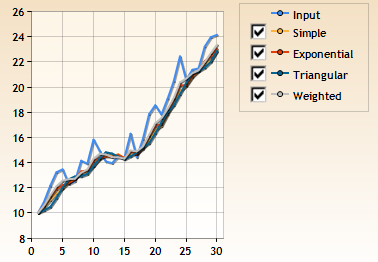
A Simple Moving Average is an average of data calculated over a period of time. The moving average is the most popular price indicator used in technical analysis, and can be used with any price, for example, Hi, Low, Open and Close, or can be applied to other indicators.  |
| 趋同分歧移动平均 | MovingAverageConvergenceDivergence |
The Moving Average Convergence/Divergence indicator compares two moving averages of prices and is used with a 9-day Exponential Moving average as a signal that indicates buying and selling moments. |
| 负体积指数 | NegativeVolumeIndex |
The Negative Volume Index should be used with the Positive Volume index; the Negative Volume Index only changes if the volume decreases from the previous day. |
| 总的体积 | OnBalanceVolume |
The On Balance Volume indicator measures positive and negative volume flow. 总的体积指标措施积极的和消极的体积流量。 |
| 性能 | Performance |
The Performance indicator compares a current closing price or any other price with the first closing value from the first time period. |
| 积极的物量指数 | PositiveVolumeIndex |
The Positive Volume Index should be used with the Negative Volume index. The Positive volume index only changes if the volume decreases from the previous day. |
| 体积价格趋势 | PriceVolumeTrend |
The Price Volume Trend is a cumulative volume total that is calculated using relative changes of the closing price, and should be used with other indicators. |
| 变动率 | RateOfChange |
The Rate of Change indicator compares a specified closing price with the current price. |
| 相对强弱指标 | RelativeStrengthIndex |
The Relative Strength Index is a momentum oscillator that compares upward movements of the closing price with downward movements, and results in values that range from 0 to 100. |
| 标准偏差 | StandardDeviation |
Standard Deviation is used to indicate volatility, and measures the difference between values, for example, closing price, and their moving average. |
| 随机指标 | StochasticIndicator |
The Stochastic Indicator helps to find trend reversal by searching in a period for when the closing prices are close to low prices in an upward trending market and when the closing prices are close to high prices in a downward trending market. |
| 三角形的移动平均线 | TriangularMovingAverage |
A Triangular Moving Average is an average of data calculated over a period of time where the middle portion of data has more weight. |
| 三指数移动平均线 | TripleExponentialMovingAverage |
The Triple Exponential Moving Average is based on a triple moving average of the closing price. Its purpose is to eliminate short cycles. This indicator keeps the closing price in trends that are shorter than the specified period. |
| 典型的价格 | TypicalPrice |
Typical Price is the average value of daily prices, and can be used as a filter for trend indicators. |
| 波动性查金 | VolatilityChaikins |
The Volatility Chaikins indicator measures the difference between High and Low prices, and is used to indicate tops or bottoms of the market. |
| 体积振荡器 | VolumeOscillator |
The Volume Oscillator attempts to identify trends in volume by comparing two moving averages: one with a short period and another with a longer period. |
| 加权密切 | WeightedClose |
The Weighted Close formula calculates the average value of daily prices. The only difference between Typical Price and the Weighted Close is that the closing price has extra weight, and is considered the most important price. |
| 加权移动平均线 | WeightedMovingAverage |
Weighted Moving Average is an average of data that is calculated over a period of time, where greater weight is attached to the most recent data. |
| 威廉姆斯R | WilliamsR |
Williams %R is a momentum indicator, and is used to measure overbought and oversold levels. |

