c mschart控件使用方法汇总(一些基础用法)
c mschart控件使用方法汇总(附统计图)
c# ms chart 控件使用方法
第一个简单的chart:创建曲线图
chart1.Series.Clear();
Series series =
new Series(“Spline”);
series.ChartType
= SeriesChartType.Spline;
series.BorderWidth
= 3;
series.ShadowOffset
= 2;
// Populate new
series with data
series.Points.AddY(67);
series.Points.AddY(57);
series.Points.AddY(83);
series.Points.AddY(23);
series.Points.AddY(70);
series.Points.AddY(60);
series.Points.AddY(90);
series.Points.AddY(20);
// Add series
into the chart’s series collection
chart1.Series.Add(series);

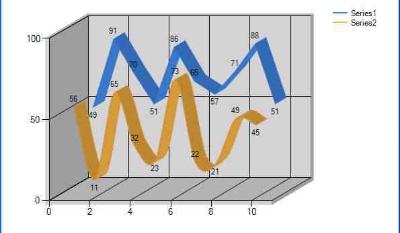
同时显示2条曲线
// Populate
series with random data
Random random =
new Random();
for (int
pointIndex = 0; pointIndex < 10;pointIndex++)
{
Chart1.Series[“Series1”].Points.AddY(random.Next(45,
95));
Chart1.Series[“Series2”].Points.AddY(random.Next(5,
75));
}
// Set series
chart type
Chart1.Series[“Series1”].ChartType
= SeriesChartType.Line;
Chart1.Series[“Series2”].ChartType
= SeriesChartType.Spline;
// Set point
labels
Chart1.Series[“Series1”].IsValueShownAsLabel
= true;
Chart1.Series[“Series2”].IsValueShownAsLabel
= true;
// Enable X axis
margin
Chart1.ChartAreas[“ChartArea1”].AxisX.IsMarginVisible
= true;
// Enable 3D,
and show data point marker lines
Chart1.ChartAreas[“ChartArea1”].Area3DStyle.Enable3D
= true;
Chart1.Series[“Series1”][“ShowMarkerLines”]
= “True”;
Chart1.Series[“Series2”][“ShowMarkerLines”]
= “True”;
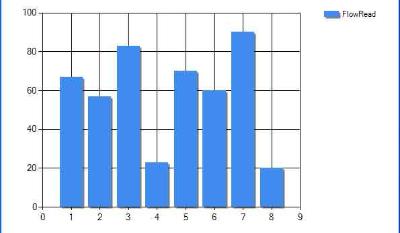
显示column类型图,柱状图
// Create new
data series and set it’s visual attributes
Chart1.Series.Clear();
Series series =
new Series(“FlowRead”);
series.ChartType
= SeriesChartType.Column;
series.BorderWidth
= 3;
series.ShadowOffset
= 2;
// Populate new
series with data
series.Points.AddY(67);
series.Points.AddY(57);
series.Points.AddY(83);
series.Points.AddY(23);
series.Points.AddY(70);
series.Points.AddY(60);
series.Points.AddY(90);
series.Points.AddY(20);
// Add series
into the chart’s series collection
Chart1.Series.Add(series);
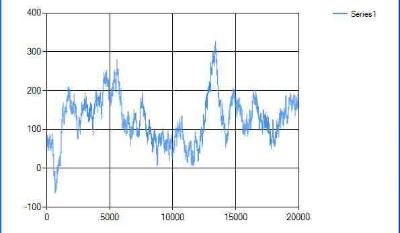
很多点,效率还可以
// Fill series
data
double yValue =
50.0;
Random random =
new Random();
for (int
pointIndex = 0; pointIndex < 20000;pointIndex++)
{
yValue = yValue
+ (random.NextDouble() * 10.0 – 5.0);
Chart1.Series[“Series1”].Points.AddY(yValue);
}
// Set fast line
chart type
Chart1.Series[“Series1”].ChartType
= SeriesChartType.FastLine;
}
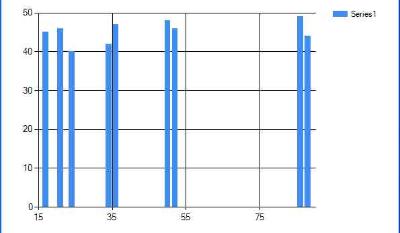
日期,xy类型
// Create a new
random number generator
Random rnd = new
Random();
// Data points X
value is using current date
DateTime date =
DateTime.Now.Date;
// Add points to
the stock chart series
for (int index =
0; index < 10; index++)
{
Chart1.Series[“Series1”].Points.AddXY(
date, // X value
is a date
rnd.Next(40,50));
//Close Y value
// Add 1 day to
our X value
date =
date.AddDays(1);
}
int-int的xy数据绘图
// Create a new
random number generator
Random rnd = new
Random();
// Add points to
the stock chart series
for (int index =
0; index < 10; index++)
{
Chart1.Series[“Series1”].Points.AddXY(
rnd.Next(10,90),
// X value is a date
rnd.Next(40,50));
//Close Y value
}
数据库数据,datetime-int类型
Chart1.Series.Clear();
OleDbConnection
conn = new OleDbConnection(“Provider=Microsoft.Jet.OLEDB.4.0;Data
Source=” +
Application.StartupPath
+ @”\db.mdb” + “;Persist Security Info=False”);
OleDbCommand cmd
= conn.CreateCommand();
conn.Open();
cmd.CommandText
= “select 时间,序号 from pub_log_read order by 序号 asc”;
//DataSet ds =
new DataSet();
//OleDbDataAdapter
da = new OleDbDataAdapter();
//da.SelectCommand
= cmd;
//da.Fill(ds,
“tbscore”);
OleDbDataReader
dr = cmd.ExecuteReader(CommandBehavior.CloseConnection);
Chart1.DataBindTable(dr,
“时间”);
dr.Close();
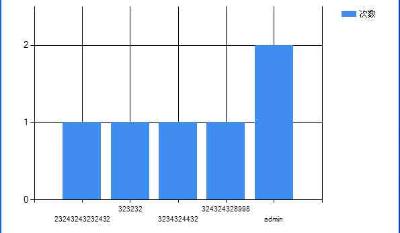
数据库数据2,string-int类型
Chart1.Series.Clear();
OleDbConnection
conn = new OleDbConnection(“Provider=Microsoft.Jet.OLEDB.4.0;Data
Source=” +
Application.StartupPath
+ @”\db.mdb” + “;Persist Security Info=False”);
OleDbCommand cmd
= conn.CreateCommand();
conn.Open();
cmd.CommandText
= “select 账号,count(账号) as 次数 from pub_log_read group by 账号 order by 账号
asc”;
//DataSet ds =
new DataSet();
//OleDbDataAdapter
da = new OleDbDataAdapter();
//da.SelectCommand
= cmd;
//da.Fill(ds,
“tbscore”);
OleDbDataReader
dr = cmd.ExecuteReader(CommandBehavior.CloseConnection);
Chart1.DataBindTable(dr,
“账号”);
dr.Close();
数据库绑定3-string-int型
Chart1.Series.Clear();
Chart1.Series.Add(“Series1”);
OleDbConnection
conn = new OleDbConnection(“Provider=Microsoft.Jet.OLEDB.4.0;Data
Source=” +
Application.StartupPath
+ @”\db.mdb” + “;Persist Security Info=False”);
OleDbCommand cmd
= conn.CreateCommand();
cmd.CommandText
= “select 账号,count(账号) as 次数 from pub_log_read group by 账号 order
by 账号 asc”;
conn.Open();
DataSet ds = new
DataSet();
OleDbDataAdapter
da = new OleDbDataAdapter();
da.SelectCommand
= cmd;
da.Fill(ds,
“tbscore”);
Chart1.DataSource
= ds;
Chart1.Series[“Series1”].XValueMember
= “账号”;
Chart1.Series[“Series1”].YValueMembers
= “次数”;
// Data bind to
the selected data source
Chart1.DataBind();
conn.Close();
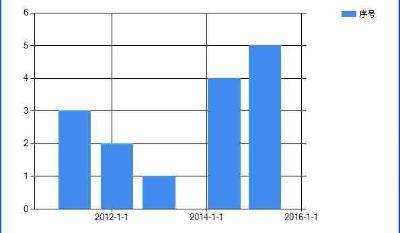
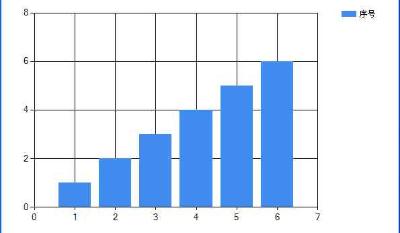
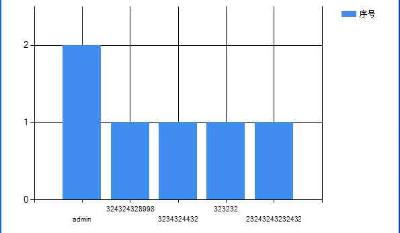
数据库4,只绑定y
Chart1.Series.Clear();
Chart1.Series.Add(“序号”);
OleDbConnection
conn = new OleDbConnection(“Provider=Microsoft.Jet.OLEDB.4.0;Data
Source=” +
Application.StartupPath
+ @”\db.mdb” + “;Persist Security Info=False”);
OleDbCommand cmd
= conn.CreateCommand();
conn.Open();
cmd.CommandText
= “select 序号 from pub_log_read order by 序号 asc”;
//DataSet ds =
new DataSet();
//OleDbDataAdapter
da = new OleDbDataAdapter();
//da.SelectCommand
= cmd;
//da.Fill(ds,
“tbscore”);
OleDbDataReader
dr = cmd.ExecuteReader(CommandBehavior.CloseConnection);
Chart1.Series[0].Points.DataBindY(dr);
dr.Close();
数据库5,绑定xy
Chart1.Series.Clear();
Chart1.Series.Add(“序号”);
OleDbConnection
conn = new OleDbConnection(“Provider=Microsoft.Jet.OLEDB.4.0;Data
Source=” +
Application.StartupPath
+ @”\db.mdb” + “;Persist Security Info=False”);
OleDbCommand cmd
= conn.CreateCommand();
conn.Open();
cmd.CommandText
= “select 账号,count(账号) as 次数 from pub_log_read group by 账号 order by 账号
desc”;
//DataSet ds =
new DataSet();
//OleDbDataAdapter
da = new OleDbDataAdapter();
//da.SelectCommand
= cmd;
//da.Fill(ds,
“tbscore”);
OleDbDataReader
dr = cmd.ExecuteReader(CommandBehavior.CloseConnection);
Chart1.Series[0].Points.DataBindXY(dr,”账号”,dr,”次数”);
dr.Close();
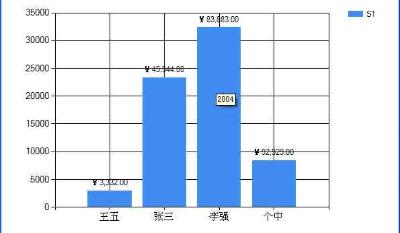
数据库6,支持显示参数
Chart1.Series.Clear();
Chart1.Series.Add(“S1”);
OleDbConnection
conn = new OleDbConnection(“Provider=Microsoft.Jet.OLEDB.4.0;Data
Source=” +
Application.StartupPath
+ @”\db.mdb” + “;Persist Security Info=False”);
OleDbCommand cmd
= conn.CreateCommand();
conn.Open();
cmd.CommandText
= “SELECT * FROM REPSALES WHERE Year=2004”;
//DataSet ds =
new DataSet();
//OleDbDataAdapter
da = new OleDbDataAdapter();
//da.SelectCommand
= cmd;
//da.Fill(ds,
“tbscore”);
OleDbDataReader
dr = cmd.ExecuteReader(CommandBehavior.CloseConnection);
Chart1.Series[0].Points.DataBind(dr,
“name”, “sales”, “Tooltip=Year,
Label=Commissions{C2}”);
dr.Close();
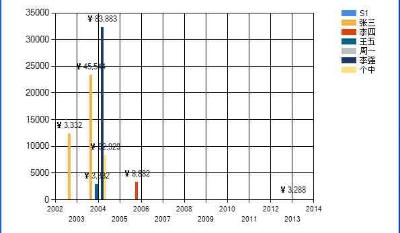
数据库7,支持多line
Chart1.Series.Clear();
Chart1.Series.Add(“S1”);
OleDbConnection
conn = new OleDbConnection(“Provider=Microsoft.Jet.OLEDB.4.0;Data
Source=” +
Application.StartupPath
+ @”\db.mdb” + “;Persist Security Info=False”);
OleDbCommand cmd
= conn.CreateCommand();
conn.Open();
cmd.CommandText
= “SELECT * FROM REPSALES”;
//DataSet ds =
new DataSet();
//OleDbDataAdapter
da = new OleDbDataAdapter();
//da.SelectCommand
= cmd;
//da.Fill(ds,
“tbscore”);
OleDbDataReader
dr = cmd.ExecuteReader(CommandBehavior.CloseConnection);
Chart1.DataBindCrossTable(dr,
“Name”, “Year”, “Sales”,
“Label=Commissions{C}”);
dr.Close();
数据库8,按照行添加数据
// Resolve the
address to the Access database
stringfileNameString
= this.MapPath(“.”);
fileNameString
+= “..\\..\\..\\data\\chartdata.mdb”;
//Initialize a
connectionstring
stringmyConnectionString
= “PROVIDER=Microsoft.Jet.OLEDB.4.0;DataSource=” + fileNameString;
// Definethe
databasequery
stringmySelectQuery=”SELECT
* FROM SALESCOUNTS;”;
// Createa
database connection object using the connectionstring
OleDbConnection
myConnection = newOleDbConnection(myConnectionString);
// Create
adatabase command on the connection usingquery
OleDbCommandmyCommand
= new OleDbCommand(mySelectQuery, myConnection);
// Open
theconnection
myCommand.Connection.Open();
//Initializes a
new instance of the OleDbDataAdapter class
OleDbDataAdapter
myDataAdapter = new OleDbDataAdapter();
myDataAdapter.SelectCommand
= myCommand;
//Initializes a
new instance of the DataSet class
DataSetmyDataSet
= new DataSet();
// Addsrows in
the DataSet
myDataAdapter.Fill(myDataSet,”Query”);
foreach(DataRow
row in myDataSet.Tables[“Query”].Rows)
{
// For each Row
add a new series
string
seriesName = row[“SalesRep”].ToString();
Chart1.Series.Add(seriesName);
Chart1.Series[seriesName].ChartType
= SeriesChartType.Line;
Chart1.Series[seriesName].BorderWidth
= 2;
for(int colIndex
= 1; colIndex <myDataSet.Tables[“Query”].Columns.Count;
colIndex++)
{
// For each
column (column 1 and onward) add the value as apoint
string
columnName =myDataSet.Tables[“Query”].Columns[colIndex].ColumnName;
int YVal = (int)
row[columnName];
Chart1.Series[seriesName].Points.AddXY(columnName,
YVal);
}
}
DataGrid.DataSource
= myDataSet;
DataGrid.DataBind();
// Closesthe
connection to the data source. This is the preferred
// method
ofclosing any open connection.
myCommand.Connection.Close();
使用xml数据
// resolve the
address to the XML document
stringfileNameString
= this.MapPath(“.”);
stringfileNameSchema
= this.MapPath(“.”);
fileNameString
+= “..\\..\\..\\data\\data.xml”;
fileNameSchema
+= “..\\..\\..\\data\\data.xsd”;
//Initializes a
new instance of the DataSet class
DataSetcustDS =
new DataSet();
// Read
XMLschema into the DataSet.
custDS.ReadXmlSchema(
fileNameSchema );
// ReadXML
schema and data into the DataSet.
custDS.ReadXml(
fileNameString );
//Initializes a
new instance of the DataView class
DataViewfirstView
= new DataView(custDS.Tables[0]);
// Sincethe
DataView implements and IEnumerable, pass the reader directlyinto
//
theDataBindTable method with the name of the column used for the Xvalue.
Chart1.DataBindTable(firstView,
“Name”);
使用excel数据
// resolve the
address to the Excel file
stringfileNameString
= this.MapPath(“.”);
fileNameString
+= “..\\..\\..\\data\\ExcelData.xls”;
//
Createconnection object by using the preceding connection string.
string sConn=
“Provider=Microsoft.Jet.OLEDB.4.0;Data Source=” +
fileNameString +
“;Extended Properties=”Excel8.0;HDR=YES””;
OleDbConnection
myConnection = new OleDbConnection( sConn );
myConnection.Open();
// Thecode to
follow uses a SQL SELECT command to display the data fromthe worksheet.
// Createnew
OleDbCommand to return data from worksheet.
OleDbCommandmyCommand
= new OleDbCommand( “Select * From [data1$A1:E25]”,myConnection );
// createa databasereader
OleDbDataReader
myReader
=myCommand.ExecuteReader(CommandBehavior.CloseConnection);
//Populate the
chart with data in the file
Chart1.DataBindTable(myReader,
“HOUR”);
// closethe
reader and the connection
myReader.Close();
myConnection.Close();
使用csv数据
// Filename of
the CSV file
string file=
“DataFile.csv”;
// Getthe path
of the CSV file
string path=
this.MapPath(“.”);
path
+=”..\\..\\..\\data\”;
// Createa
select statement and a connection string.
stringmySelectQuery
= “Select * from ” + file;
stringConStr =
“Provider=Microsoft.Jet.OLEDB.4.0;Data Source=”+
path+
“;Extended Properties=”Text;HDR=No;FMT=Delimited””;
OleDbConnection
myConnection = new OleDbConnection(ConStr);
// Createa
database command on the connection using query
OleDbCommandmyCommand
= new OleDbCommand(mySelectQuery, myConnection);
// Openthe
connection and create the reader
myCommand.Connection.Open();
OleDbDataReader
myReader
=myCommand.ExecuteReader(CommandBehavior.CloseConnection);
// Column1 is a
time value, column 2 is a double
// Databindthe
reader to the chart using the DataBindXY method
Chart1.Series[0].Points.DataBindXY(myReader,
“1”, myReader,”2″);
//
Closeconnection and data reader
myReader.Close();
myConnection.Close();
数组绘图
// Initialize an
array of doubles
double[] yval =
{ 2, 6, 4, 5, 3 };
// Initialize an
array of strings
string[] xval =
{ “Peter”, “Andrew”, “Julie”, “Mary”,
“Dave” };
// Bind the
double array to the Y axis points of the Default dataseries
Chart1.Series[“Series1”].Points.DataBindXY(xval,
yval); 数据库9,dataview// Resolve the address to the Access database
stringfileNameString
= this.MapPath(“.”);
fileNameString
+= “..\\..\\..\\data\\chartdata.mdb”;
//Initialize a
connectionstring
stringmyConnectionString
= “PROVIDER=Microsoft.Jet.OLEDB.4.0;DataSource=” + fileNameString;
// Definethe
databasequery
stringmySelectQuery=”SELECT
* FROM REPS;”;
// Createa
database connection object using the connectionstring
OleDbConnection
myConnection = newOleDbConnection(myConnectionString);
// Create
adatabase command on the connection usingquery
OleDbCommandmyCommand
= new OleDbCommand(mySelectQuery, myConnection);
// Open
theconnection
myCommand.Connection.Open();
//Initializes a
new instance of the OleDbDataAdapter class
OleDbDataAdapter
custDA = new OleDbDataAdapter();
custDA.SelectCommand
= myCommand;
//Initializes a
new instance of the DataSet class
DataSetcustDS =
new DataSet();
// Addsrows in
the DataSet
custDA.Fill(custDS,
“Customers”);
//Initializes a
new instance of the DataView class
DataViewfirstView
= new DataView(custDS.Tables[0]);
// Sincethe
DataView implements IEnumerable, pass the dataview directlyinto
// the DataBind
method with thename of the Columns selected in thequery
Chart1.Series[“Default”].Points.DataBindXY(firstView,”Name”,firstView,
“Sales”);
// Closesthe
connection to the data source. This is the preferred
// method of
closing any openconnection.
myCommand.Connection.Close();
指定坐标轴的数据显示范围
// Create a new
random number generator
Random rnd = new
Random();
// Add points to
the stock chart series
for (int index =
0; index < 10; index++)
{
Chart1.Series[“Series1”].Points.AddXY(
rnd.Next(10,90),
// X value is a date
rnd.Next(40,50));
//Close Y value
}
Chart1.ChartAreas[0].AxisY.Minimum
= 40;
Chart1.ChartAreas[0].AxisY.Maximum
= 50;
数据排序// Use point
index for drawing the chart
Chart1.Series[“Series1”].IsXValueIndexed
= true;
// Sortseries
points by second Y value
Chart1.DataManipulator.Sort(PointSortOrder.Ascending,
“Y2″,”Series1”);
查找数据最大值和最小值
// Find point
with maximum Y value and change color
DataPointmaxValuePoint
=Chart1.Series[“Series1”].Points.FindMaxValue();
maxValuePoint.Color
= Color.FromArgb(255, 128, 128);
// Findpoint
with minimum Y value and change color
DataPointminValuePoint
=Chart1.Series[“Series1”].Points.FindMinValue();
minValuePoint.Color
= Color.FromArgb(128, 128, 255); pie显示交互
private void
Page_Load(object sender, System.EventArgs e) {
// Addseries to
the chart
Seriesseries =
Chart1.Series.Add(“My series”);
// Setseries and
legend tooltips
series.ToolTip =
“#VALX: #VAL{C} million”;
series.LegendToolTip
= “#PERCENT”;
series.PostBackValue
= “#INDEX”;
series.LegendPostBackValue
= “#INDEX”;
//
Populateseries data
double[] yValues
= {65.62, 75.54, 60.45, 34.73, 85.42, 32.12, 55.18, 67.15,56.24, 23.65};
string[] xValues
= {“France”, “Canada”, “Germany”,
“USA”, “Italy”, “Russia”,”China”,
“Japan”,
“Sweden”,
“Spain” };
series.Points.DataBindXY(xValues,
yValues);
// Setseries
visual attributes
series.Type=
SeriesChartType.Pie;
series.ShadowOffset
= 2;
series.BorderColor
= Color.DarkGray;
series.CustomAttributes
= “LabelStyle=Outside”;
}
protected void
Chart1_Click(object sender, ImageMapEventArgse) {
intpointIndex =
int.Parse(e.PostBackValue);
Seriesseries =
Chart1.Series[“My series”];
if(pointIndex
>= 0 &&pointIndex < series.Points.Count)
{
series.Points[pointIndex].CustomProperties
+=”Exploded=true”;
}
}
chart点击事件///
<summary>
/// Page Load
event handler.
///
</summary>
protected void
Page_Load(object sender, System.EventArgs e) {
this.Chart1.Click
+= new ImageMapEventHandler(Chart1_Click);
// directusing
of PostBackValue
foreach(Series
series in this.Chart1.Series)
{
series.PostBackValue
= “series:” + series.Name + “,#INDEX”;
}
// transferof
click coordinates. getCoordinates is a javascriptfunction.
stringpostbackScript
=ClientScript.GetPostBackEventReference(this.Chart1,”chart:@”);
this.Chart1.Attributes[“onclick”]
= postbackScript.Replace(“@'”, “‘+ getCoordinates(event)”);
}
///
<summary>
/// Handles the
Click event of the Chart1 control.
///
</summary>
/// <param
name=”sender”>The sourceof the event.</param> /// <param
name=”e”>The<seecref=”System.Web.UI.WebControls.ImageMapEventArgs”/>instance
containing the eventdata.</param>
protected void
Chart1_Click(object sender, ImageMapEventArgse) {
this.Chart1.Titles[“ClickedElement”].Text
= “Nothing”;
string[]input =
e.PostBackValue.Split(‘:’);
if(input.Length
== 2)
{
string[]
seriesData = input[1].Split(‘,’);
if (input[0].Equals(“series”))
{
this.Chart1.Titles[“ClickedElement”].Text
= “Last Clicked Element:” + seriesData[0] + ” –
Data Point
#” + seriesData[1];
}
else if
(input[0].Equals(“chart”))
{
// hit test of X
and Y click point
HitTestResult
hitTestResult
=this.Chart1.HitTest(Int32.Parse(seriesData[0]),Int32.Parse(seriesData[1]));
if
(hitTestResult != null)
{
this.Chart1.Titles[“ClickedElement”].Text
= “Last Clicked Element:” +
hitTestResult.ChartElementType.ToString();
}
}
}
}